by Judhi Prasetyo, Giulia De Masi, and Eliseo Ferrante
This is a supplementary document for the Special Issue of Swarm Intelligence 2018 Paper titled The best-of-n problem in dynamic environments
Table of Content
- Abstract
- Results with Various Percentage of Stubborn Agents
- Results with Fixed number of Stubborn Agents (5 for each side)
- Results of Spontaneous Switching Probability
Abstract
Collective decision-making is the ability of individuals to make a collective decision without any centralized leadership, but only relying on local interaction and communication. It can be seen as a fundamental building block for swarm robotics collective behaviours. A special case of collective decision making is represented by the best-of-n problem, whereby the swarm has to select the best option among a set of n discrete alternatives. Recently, the best-of-n problem has been studied both in cases where the quality of options can be measured by robots, as well as in cases where this is not possible but an optimal decision can be made with respect to constraints in the environment, which may bias the consensus towards one of the n options.
In this paper, we perform a thorough study of the best-of-n problem in dynamic environments. We consider the situation where site qualities can be directly measured by agents, and we introduce abrupt changes to these qualities, whereby the two qualities are swapped at a given time. Using computer simulations, we first show that the standard voter model, one of the most studied decision-making mechanism, does not guarantee adaptation to dynamic environments. We then introduce and study two novel mechanisms: stubborn agents, and spontaneous opinion switching: Stubborn agents are agents that do not change their opinion, while spontaneous opinion switching makes agent change their opinion at random after the application of the decision mechanism. These two mechanisms prove to be of primary importance to achieve adaptability in dynamic environments. In particular, we show that the mere presence of the stubborn agents is enough to achieve adaptability, but increasing its number has detrimental effects on the performance. Interestingly, we show that the system adaptation increases with increasing swarm size, while it does not depend on agent density, unless this is below a critical threshold. Finally, we demonstrate that the spontaneous switching mechanism can also be used to achieve adaptability to dynamic environments, and that its key parameter, the probability of switching, can be used to regulate the trade-off between accuracy and speed of adaptation.
Keywords: dynamic environments – collective decision making·best-of-n·swarm robotics – complex adaptive systems
Results with Various Percentage of Stubborn Agents
N=40
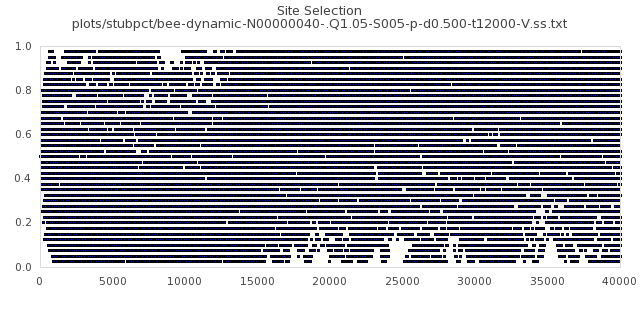
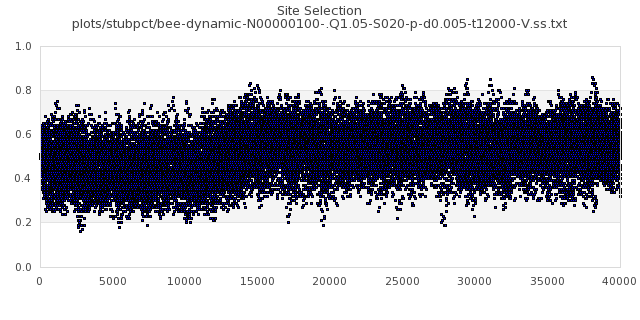
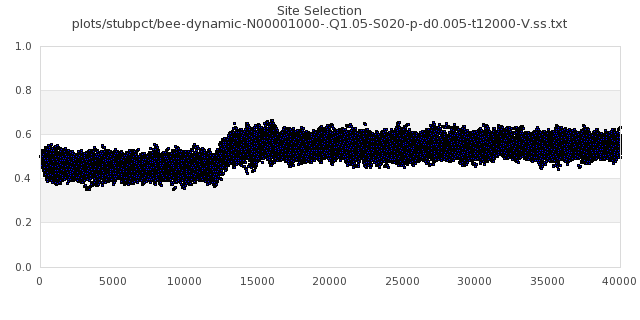
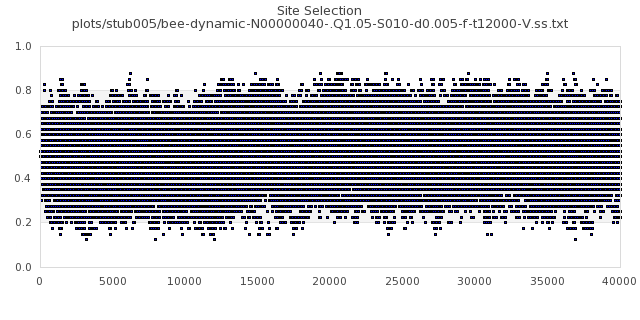
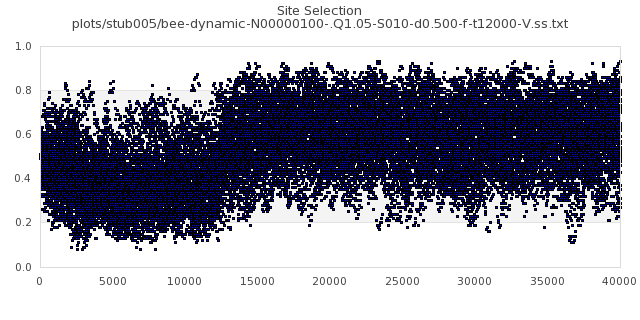
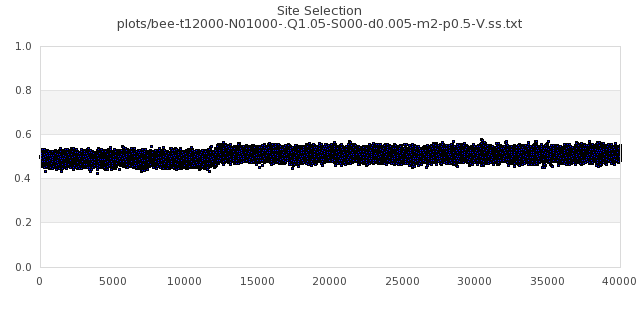
[img#1] N=40 Q=1.05 D=0.005 S=5%
 |
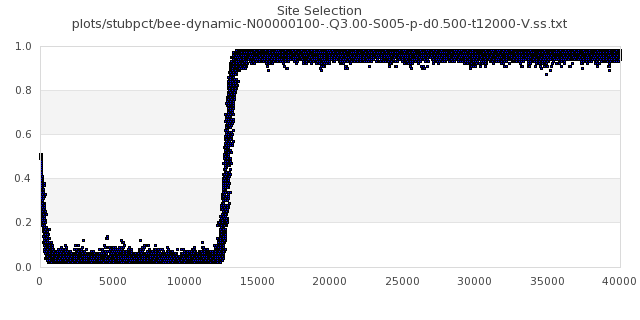
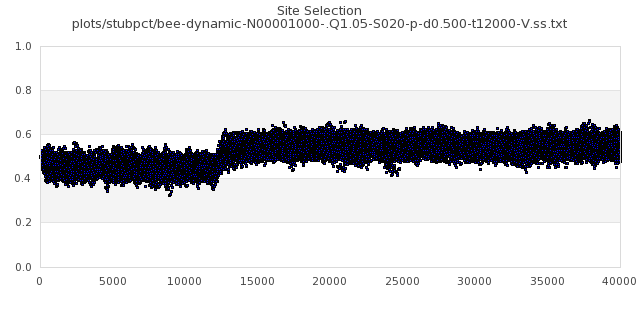
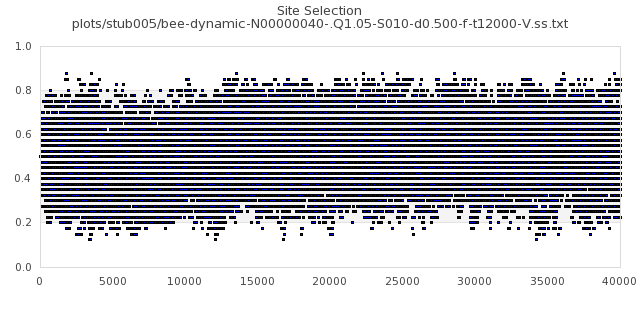
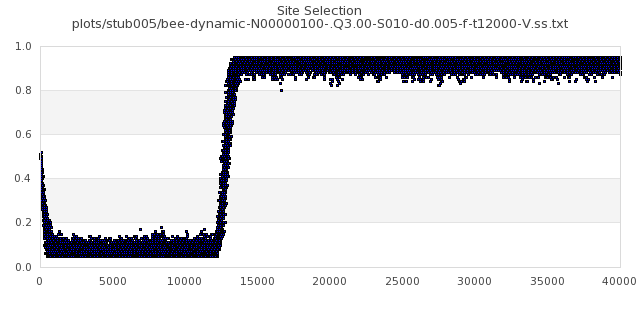
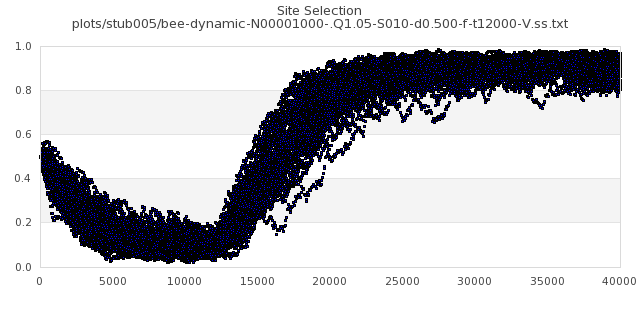
[img#2] N=40 Q=1.05 D=0.500 S=5%
 |
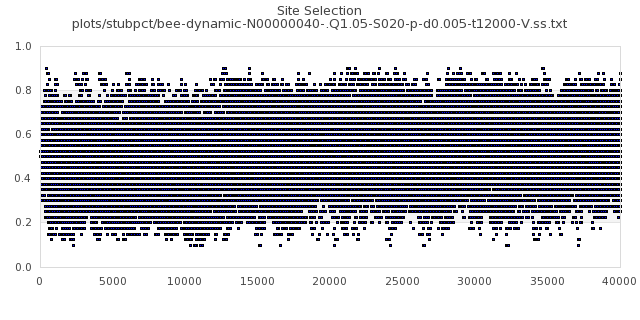
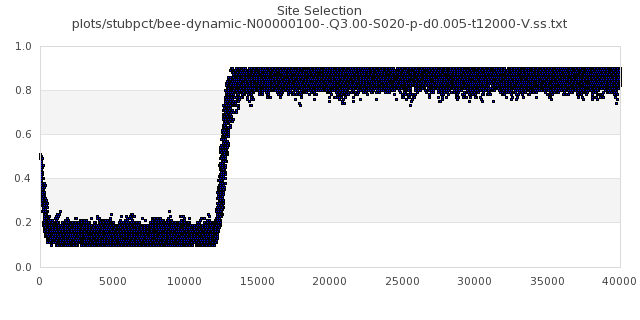
[img#3] N=40 Q=1.05 D=0.005 S=20%
 |
[img#4] N=40 Q=1.05 D=0.500 S=20%
 |
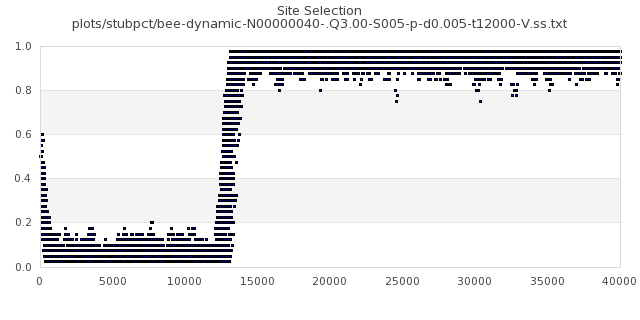
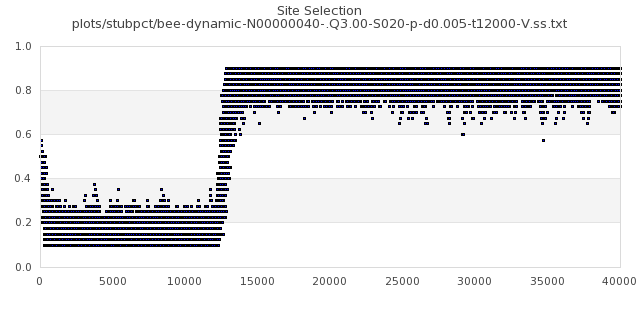
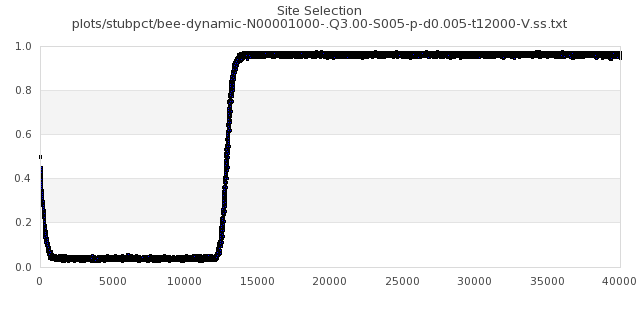
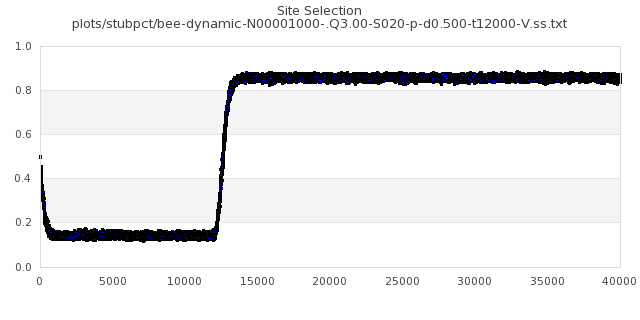
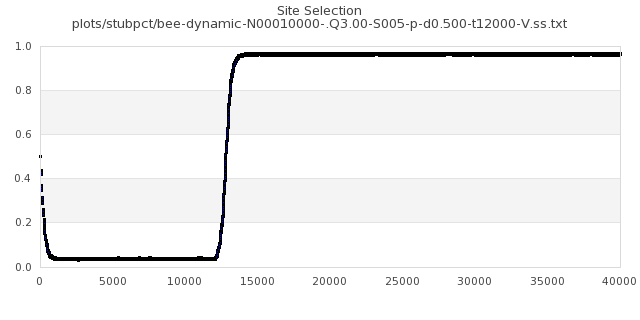
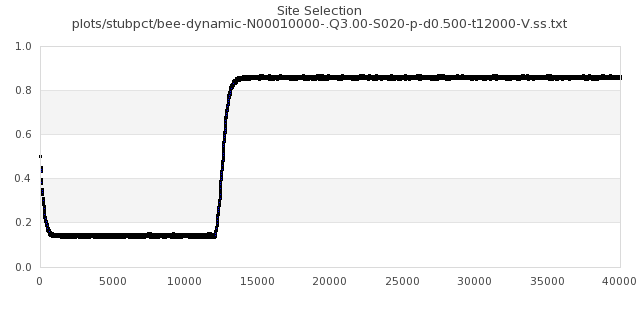
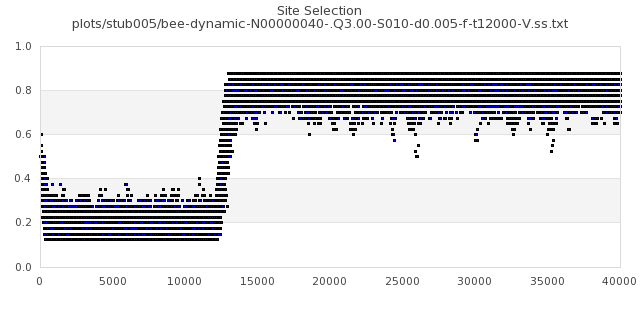
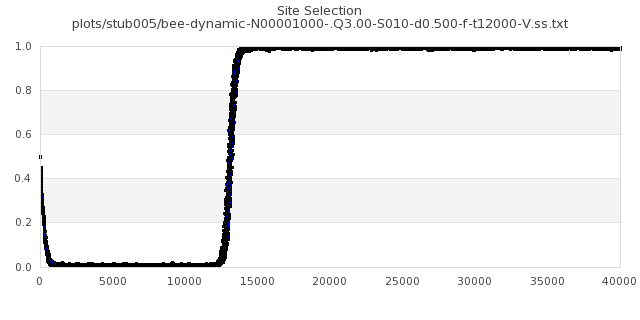
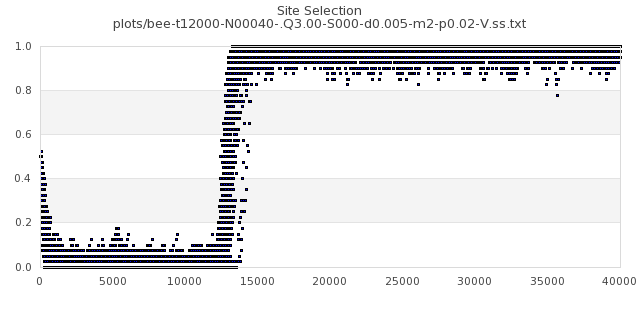
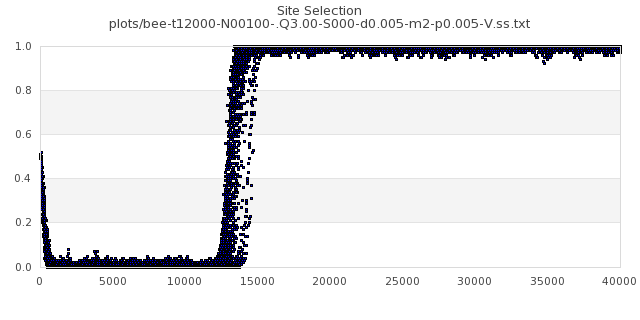
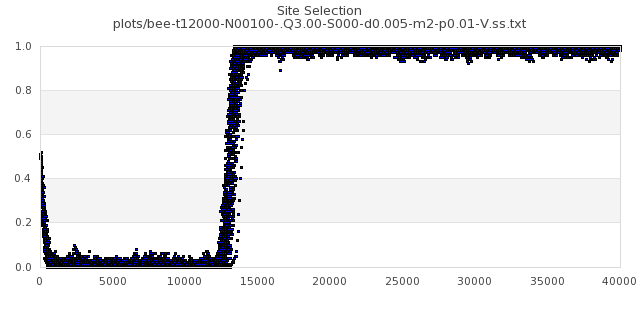
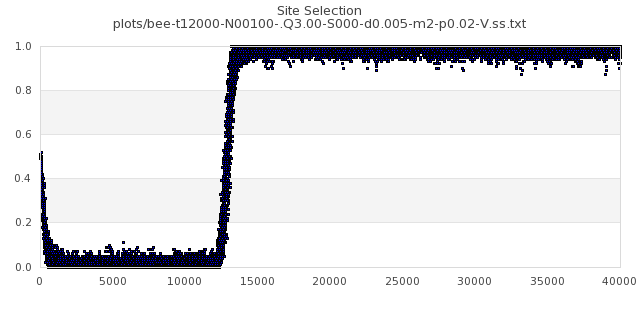
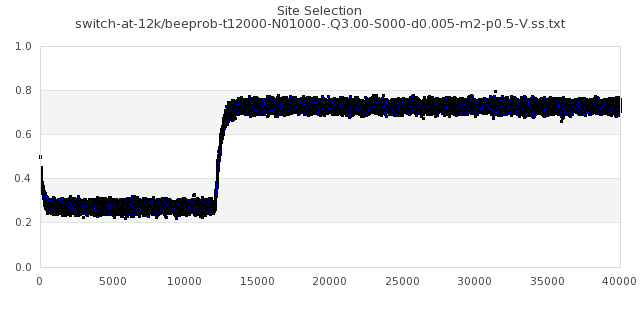
[img#5] N=40 Q=3.00 D=0.005 S=5%
 |
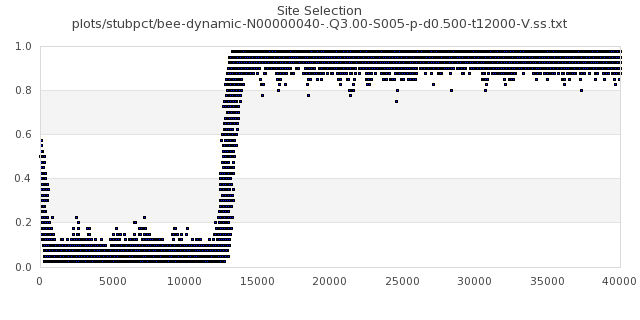
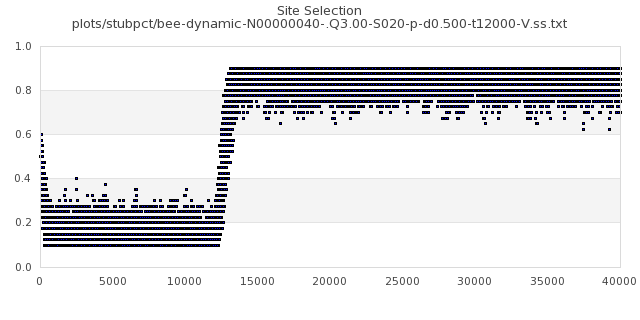
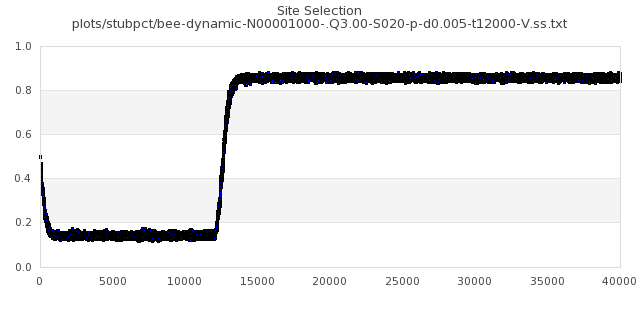
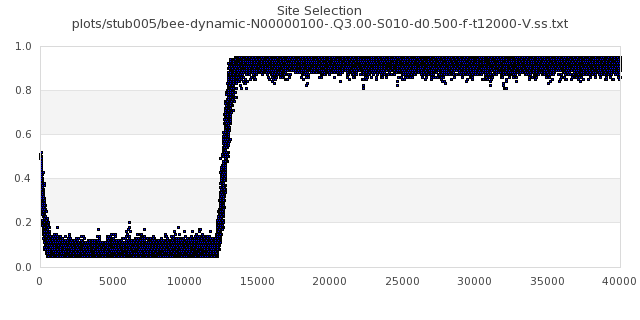
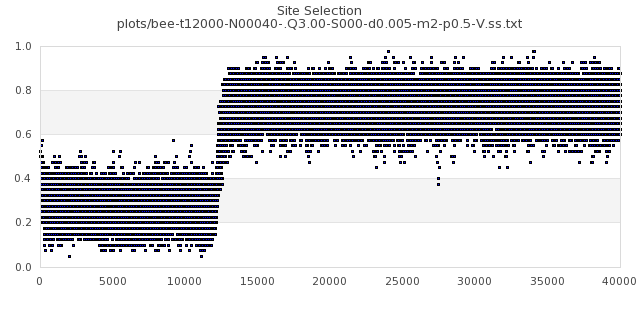
[img#6] N=40 Q=3.00 D=0.500 S=5%
 |
[img#7] N=40 Q=3.00 D=0.005 S=20%
 |
[img#8] N=40 Q=3.00 D=0.500 S=20%
 |
N=100
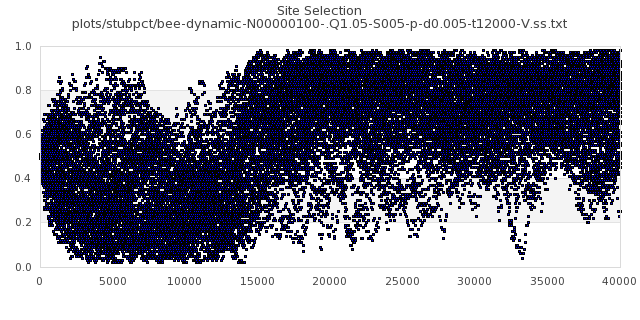
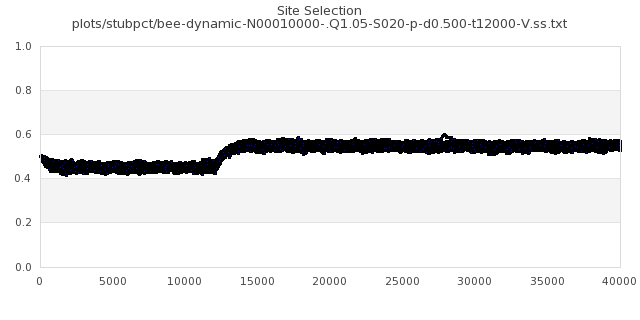
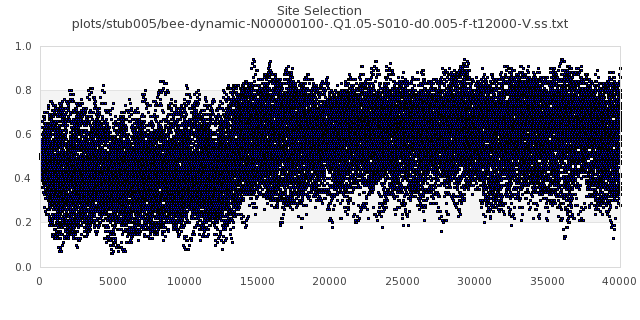
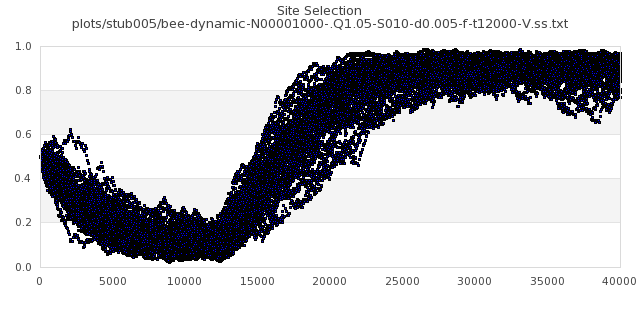
[img#9] N=100 Q=1.05 D=0.005 S=5%
 |
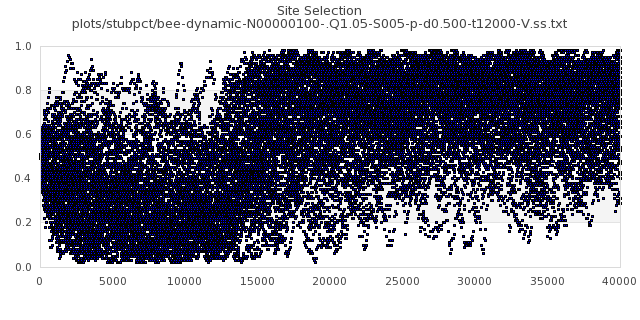
[img#10] N=100 Q=1.05 D=0.500 S=5%
 |
[img#11] N=100 Q=1.05 D=0.005 S=20%
 |
[img#12] N=100 Q=1.05 D=0.500 S=20%
 |
[img#13] N=100 Q=3.00 D=0.005 S=5%
 |
[img#14] N=100 Q=3.00 D=0.500 S=5%
 |
[img#15] N=100 Q=3.00 D=0.005 S=20%
 |
[img#16] N=100 Q=3.00 D=0.500 S=20%
 |
N=1000
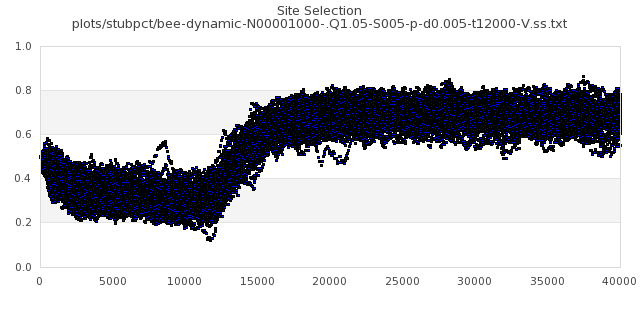
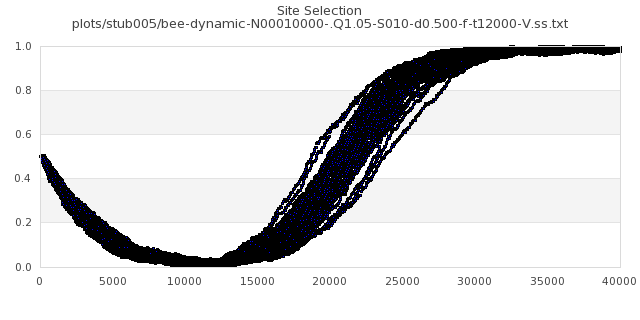
[img#17] N=1000 Q=1.05 D=0.005 S=5%
 |
[img#18] N=1000 Q=1.05 D=0.500 S=5%
 |
[img#19] N=1000 Q=1.05 D=0.005 S=20%
 |
[img#20] N=1000 Q=1.05 D=0.500 S=20%
 |
[img#21] N=1000 Q=3.00 D=0.005 S=5%
 |
[img#22] N=1000 Q=3.00 D=0.500 S=5%
 |
[img#23] N=1000 Q=3.00 D=0.005 S=20%
 |
[img#24] N=1000 Q=3.00 D=0.500 S=20%
 |
N=10000
[img#25] N=10000 Q=1.05 D=0.005 S=5%
 |
[img#26] N=10000 Q=1.05 D=0.500 S=5%
 |
[img#27] N=10000 Q=1.05 D=0.005 S=20%
 |
[img#28] N=10000 Q=1.05 D=0.500 S=20%
 |
[img#29] N=10000 Q=3.00 D=0.005 S=5%
 |
[img#30] N=10000 Q=3.00 D=0.500 S=5%
 |
[img#31] N=10000 Q=3.00 D=0.005 S=20%
 |
[img#32] N=10000 Q=3.00 D=0.500 S=20%
 |
[img#33] N=10000 Q=1.05 D=0.000 S=10%
 |
[img#34] N=10000 Q=1.05 D=0.050 S=10%
 |
Results with Fixed number of Stubborn Agents (5 for each side)
N=40
[img#1] N=40 Q=1.05 D=0.005 S=10 (5 per side)
 |
[img#2] N=40 Q=1.05 D=0.500 S=10 (5 per side)
 |
[img#3] N=40 Q=3.00 D=0.005 S=10 (5 per side)
 |
[img#4] N=40 Q=3.00 D=0.500 S=10 (5 per side)
 |
N=100
[img#5] N=100 Q=1.05 D=0.005 S=10 (5 per side)
 |
[img#6] N=100 Q=1.05 D=0.500 S=10 (5 per side)
 |
[img#7] N=100 Q=3.00 D=0.005 S=10 (5 per side)
 |
[img#8] N=100 Q=3.00 D=0.500 S=10 (5 per side)
 |
N=1000
[img#9] N=1000 Q=1.05 D=0.005 S=10 (5 per side)
 |
[img#10] N=1000 Q=1.05 D=0.500 S=10 (5 per side)
 |
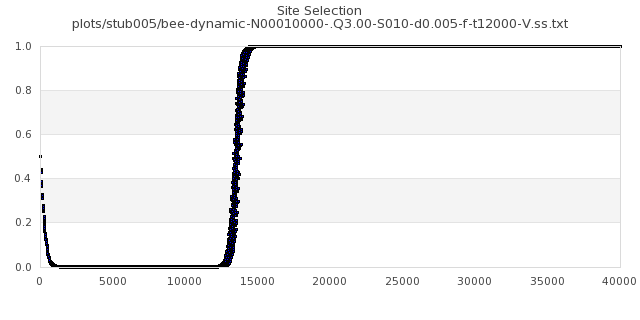
[img#11] N=1000 Q=3.00 D=0.005 S=10 (5 per side)
 |
[img#12] N=1000 Q=3.00 D=0.500 S=10 (5 per side)
 |
N=10000
[img#13] N=10000 Q=1.05 D=0.005 S=10 (5 per side)
 |
[img#14] N=10000 Q=1.05 D=0.500 S=10 (5 per side)
 |
[img#15] N=10000 Q=3.00 D=0.005 S=10 (5 per side)
 |
[img#16] N=10000 Q=3.00 D=0.500 S=10 (5 per side)
 |
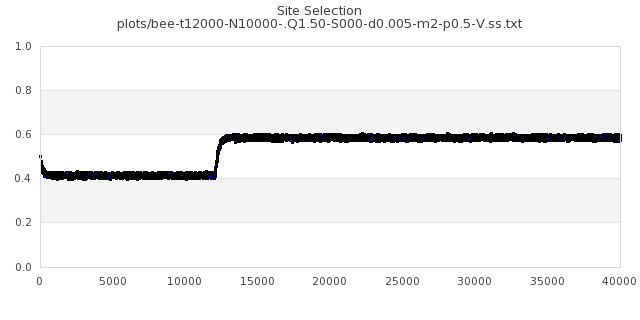
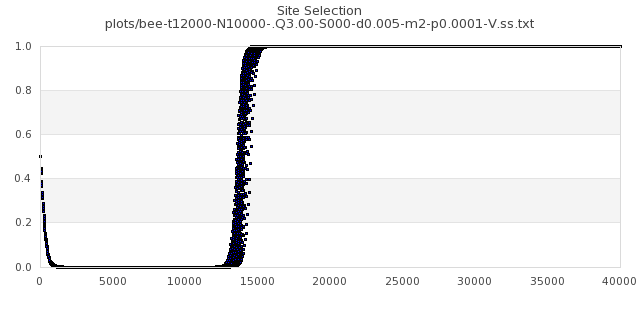
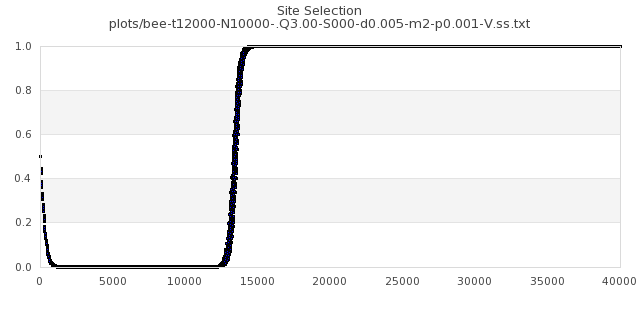
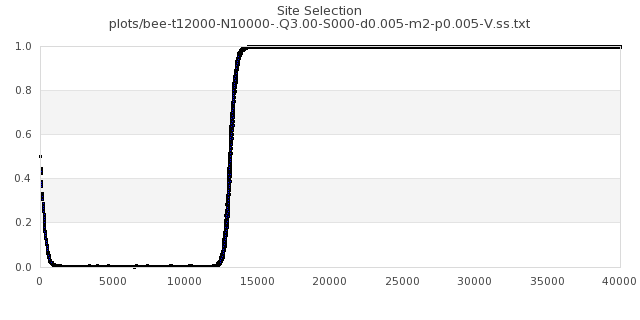
Results of Spontaneous Switching with Various Probability
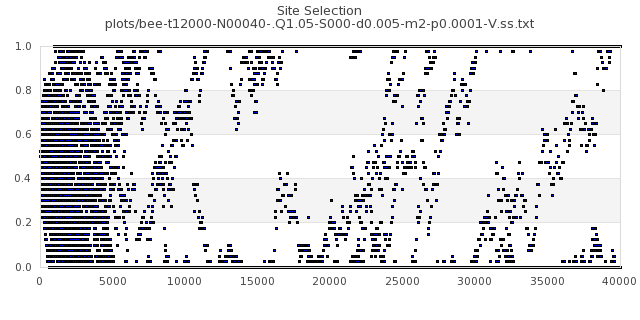
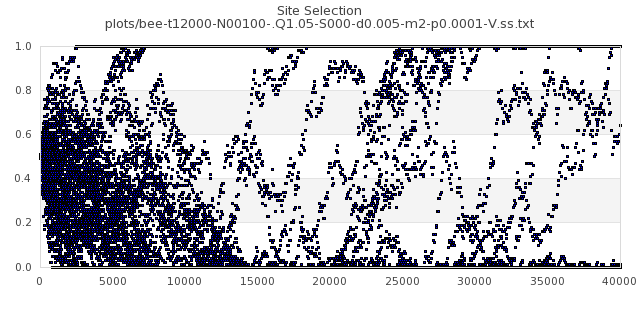
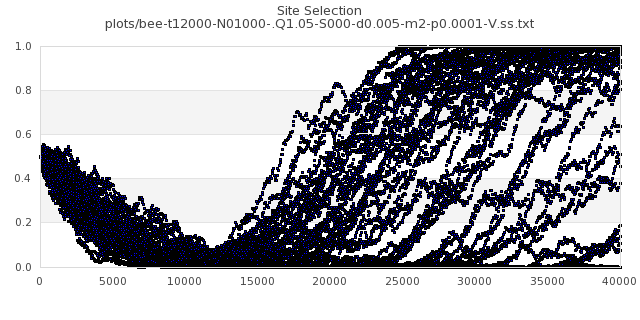
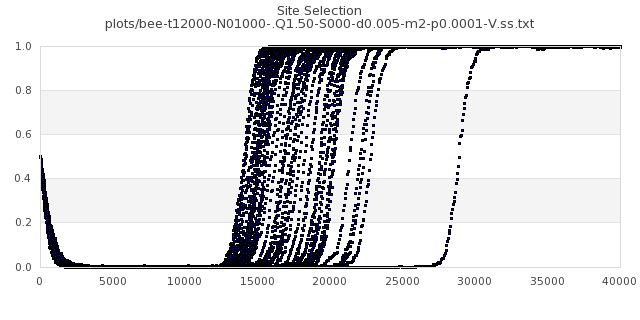
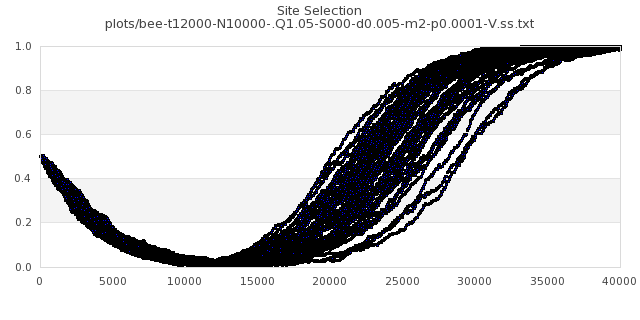
[img#1] N=40 Q=1.05 p=0.0001
 |
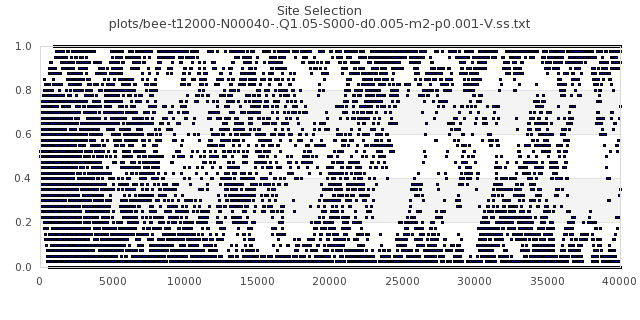
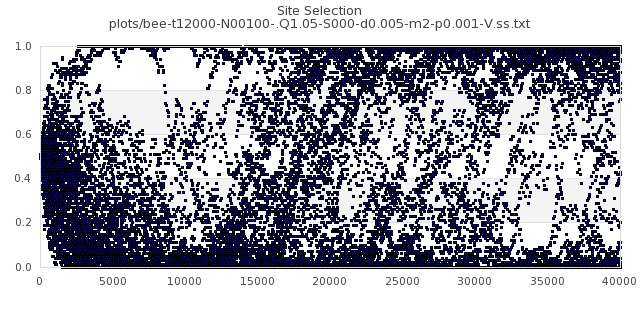
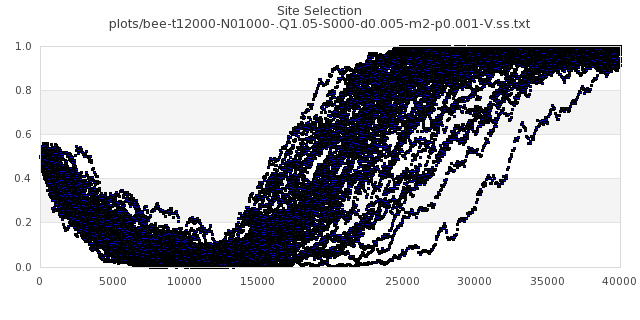
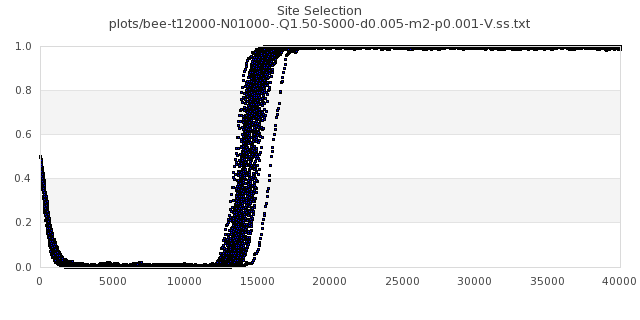
[img#2] N=40 Q=1.05 p=0.001
 |
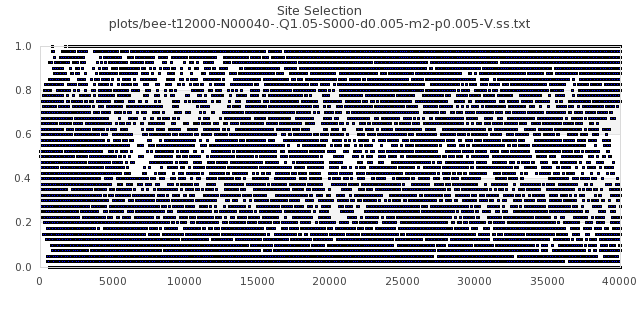
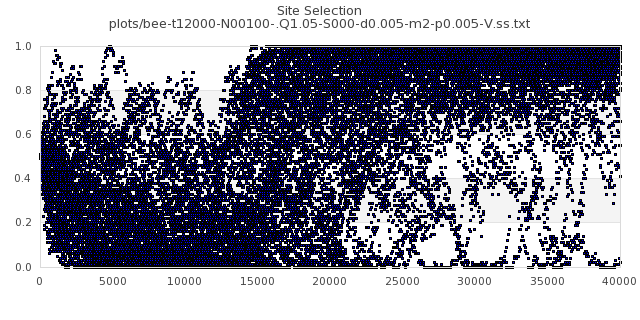
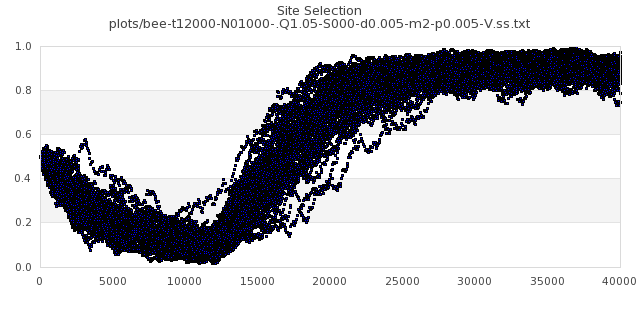
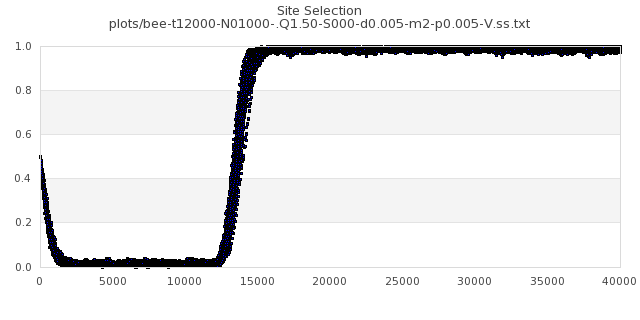
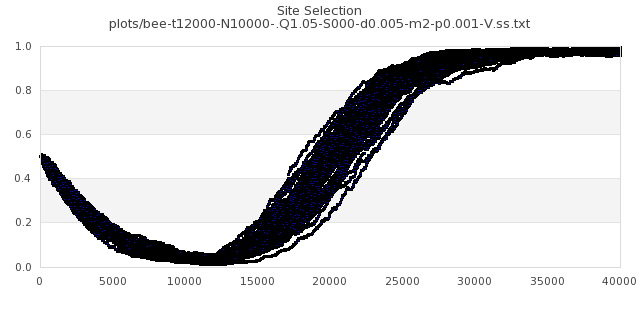
[img#3] N=40 Q=1.05 p=0.005
 |
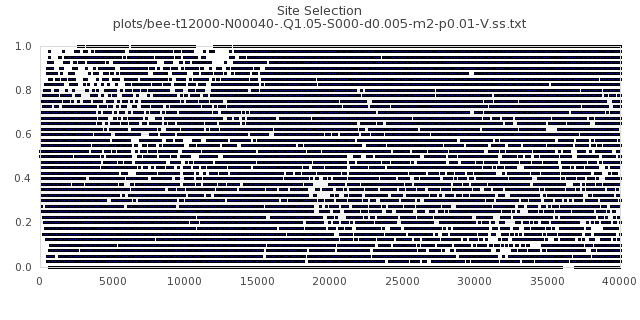
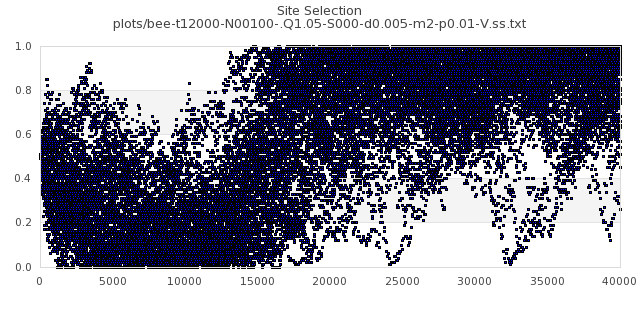
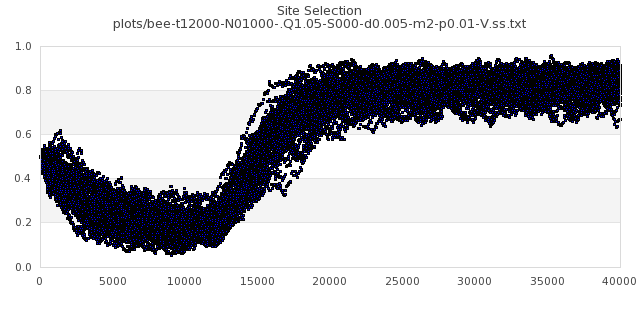
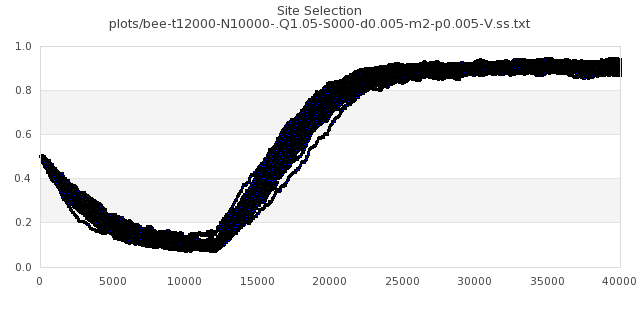
[img#4] N=40 Q=1.05 p=0.01
 |
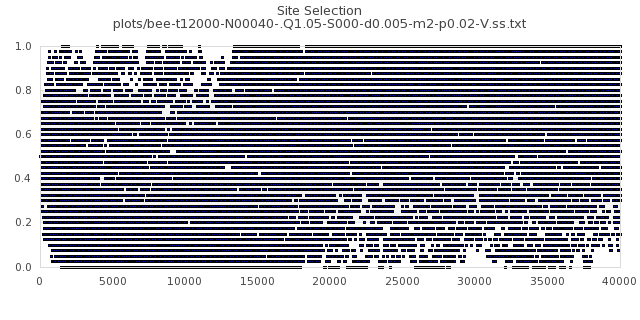
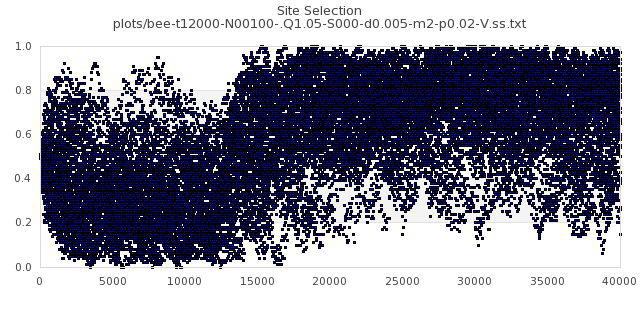
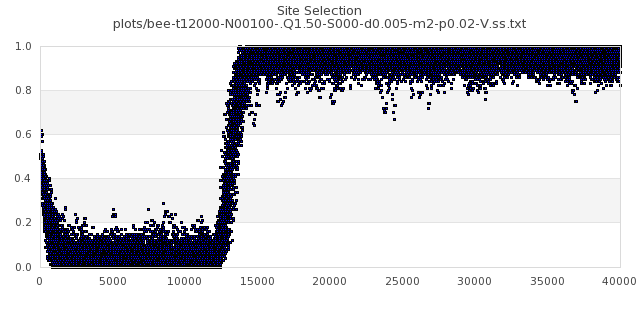
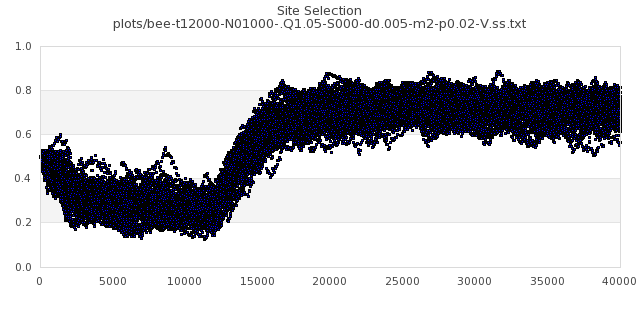
[img#5] N=40 Q=1.05 p=0.02
 |
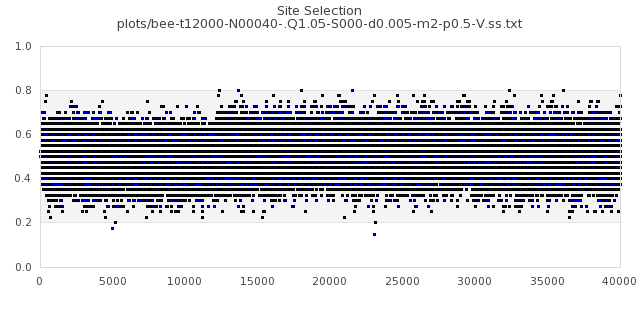
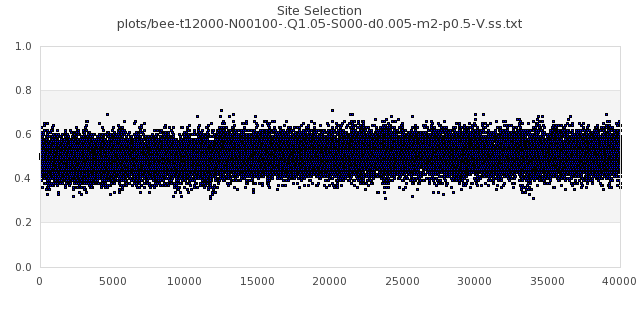
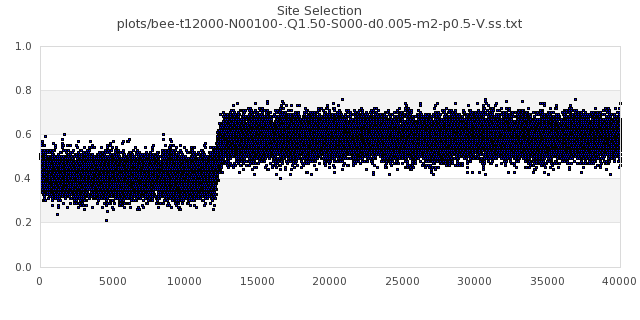
[img#6] N=40 Q=1.05 p=0.5
 |
|
|
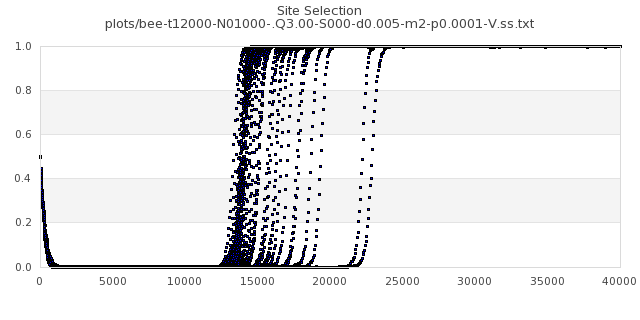
[img#7] N=40 Q=1.50 p=0.0001
 |
[img#8] N=40 Q=1.50 p=0.001
 |
[img#9] N=40 Q=1.50 p=0.005
 |
[img#10] N=40 Q=1.50 p=0.01
 |
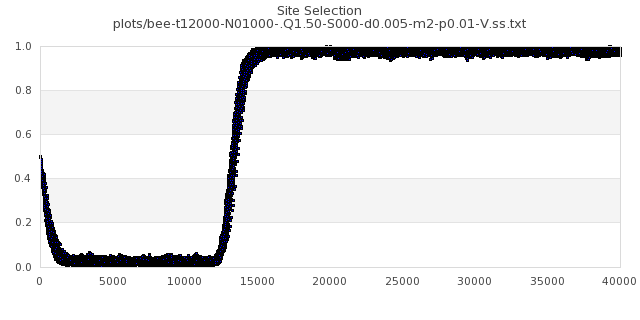
[img#11] N=40 Q=1.50 p=0.02
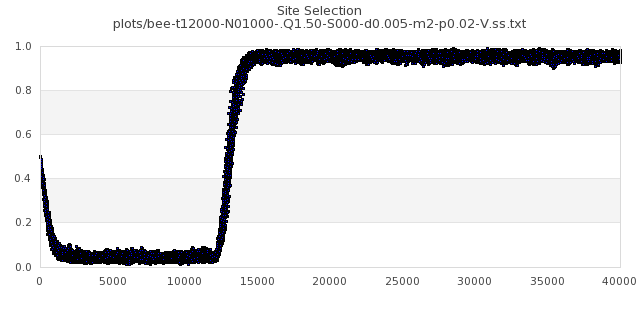
 |
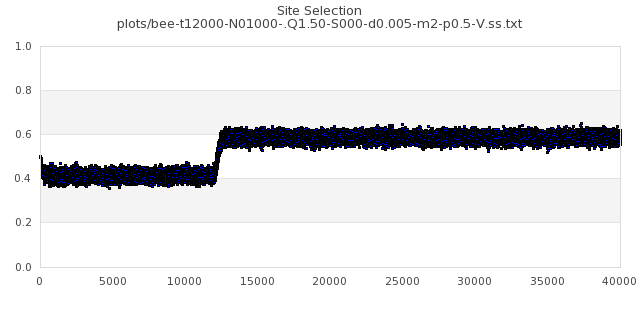
[img#12] N=40 Q=1.50 p=0.5
 |
|
|
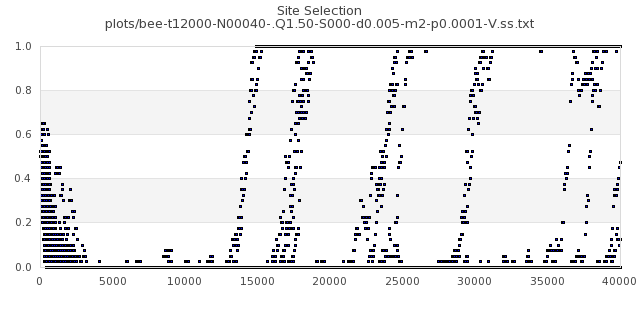
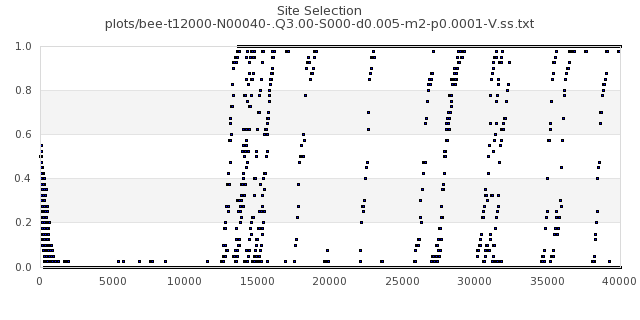
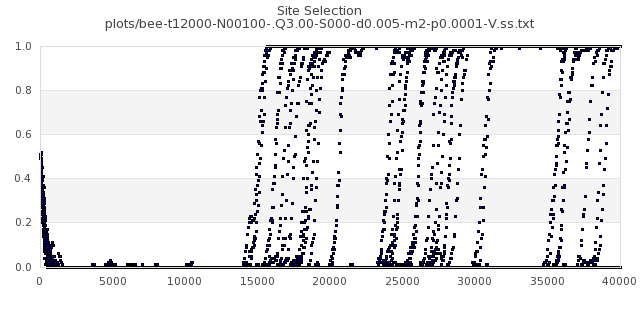
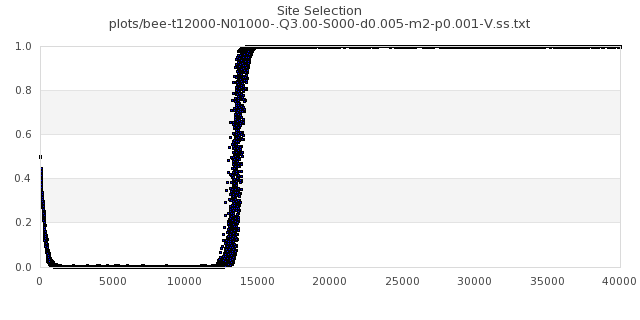
[img#13] N=40 Q=3.00 p=0.0001
 |
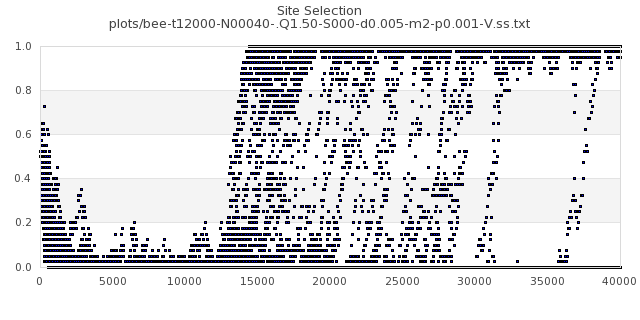
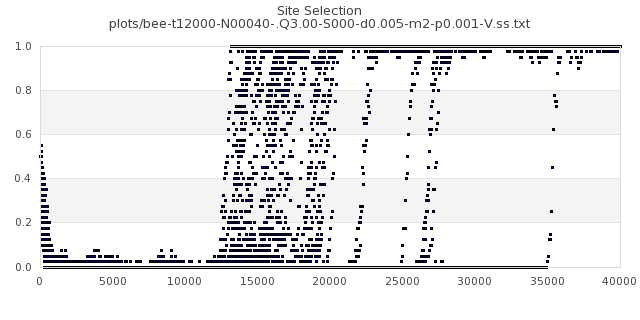
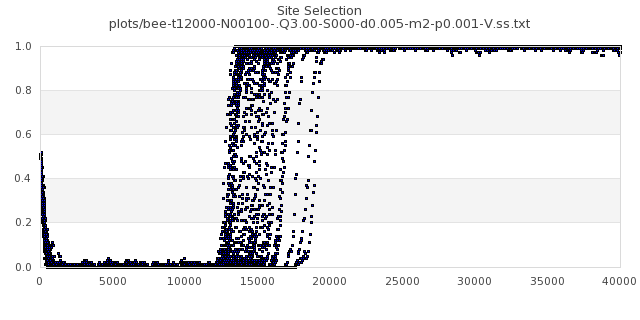
[img#14] N=40 Q=3.00 p=0.001
 |
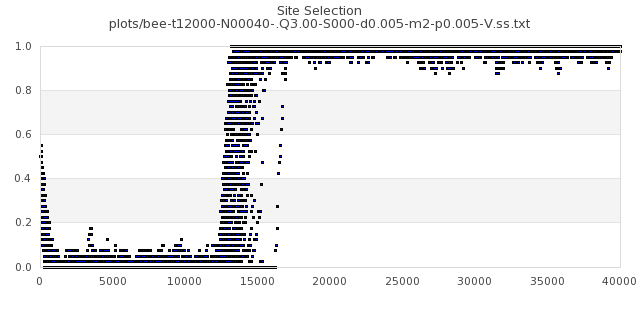
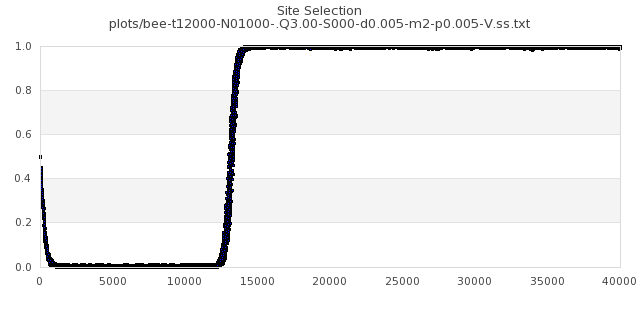
[img#15] N=40 Q=3.00 p=0.005
 |
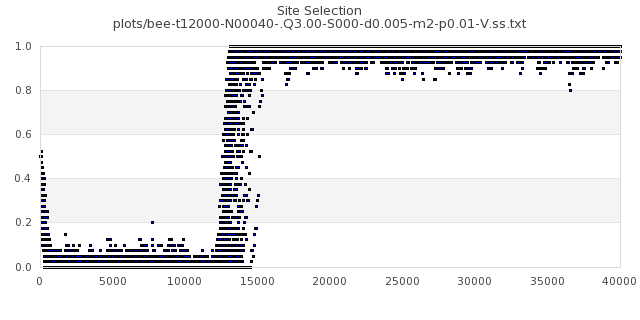
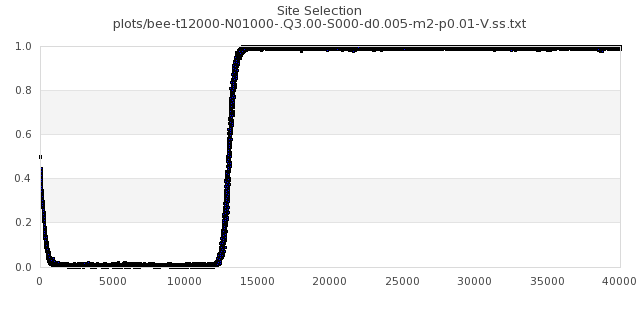
[img#16] N=40 Q=3.00 p=0.01
 |
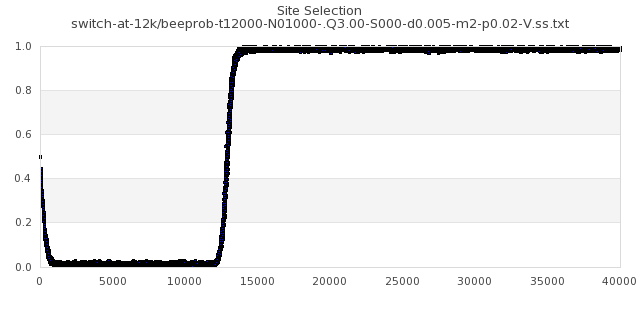
[img#17] N=40 Q=3.00 p=0.02
 |
[img#18] N=40 Q=3.00 p=0.5
 |
|
|
[img#19] N=100 Q=1.05 p=0.0001
 |
[img#20] N=100 Q=1.05 p=0.001
 |
[img#21] N=100 Q=1.05 p=0.005
 |
[img#22] N=100 Q=1.05 p=0.01
 |
[img#23] N=100 Q=1.05 p=0.02
 |
[img#24] N=100 Q=1.05 p=0.5
 |
|
|
[img#25] N=100 Q=1.50 p=0.0001
 |
[img#26] N=100 Q=1.50 p=0.001
 |
[img#27] N=100 Q=1.50 p=0.005
 |
[img#28] N=100 Q=1.50 p=0.01
 |
[img#29] N=100 Q=1.50 p=0.02
 |
[img#30] N=100 Q=1.50 p=0.5
 |
|
|
[img#31] N=100 Q=3.00 p=0.0001
 |
[img#32] N=100 Q=3.00 p=0.001
 |
[img#33] N=100 Q=3.00 p=0.005
 |
[img#34] N=100 Q=3.00 p=0.01
 |
[img#35] N=100 Q=3.00 p=0.02
 |
[img#36] N=100 Q=3.00 p=0.5
 |
|
|
[img#37] N=1000 Q=1.05 p=0.0001
 |
[img#38] N=1000 Q=1.05 p=0.001
 |
[img#39] N=1000 Q=1.05 p=0.005
 |
[img#40] N=1000 Q=1.05 p=0.01
 |
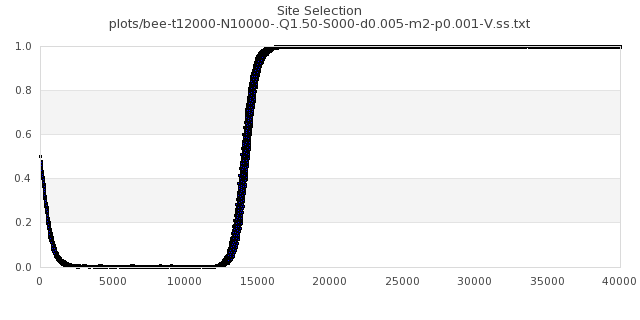
[img#41] N=1000 Q=1.05 p=0.02
 |
[img#42] N=1000 Q=1.05 p=0.5
 |
|
|
[img#43] N=1000 Q=1.50 p=0.0001
 |
[img#44] N=1000 Q=1.50 p=0.001
 |
[img#45] N=1000 Q=1.50 p=0.005
 |
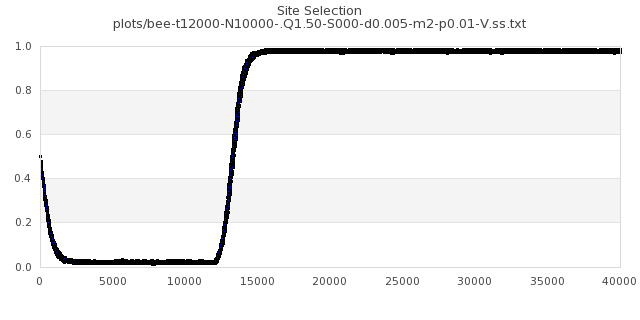
[img#46] N=1000 Q=1.50 p=0.01
 |
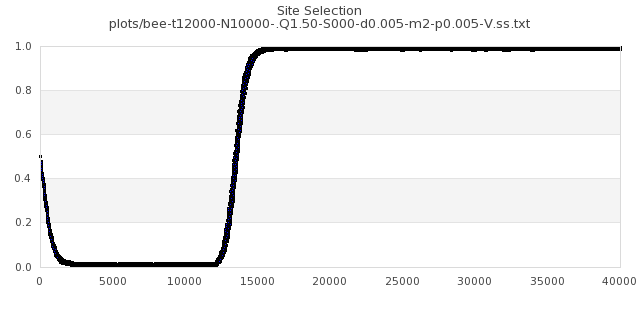
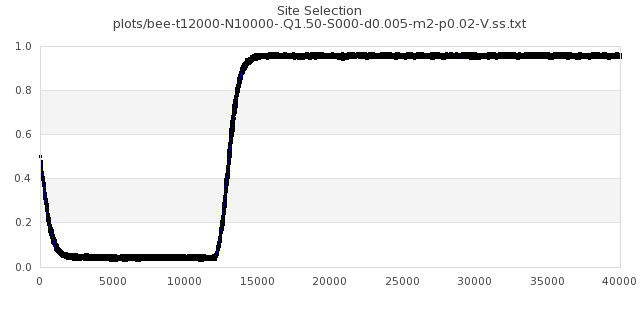
[img#47] N=1000 Q=1.50 p=0.02
 |
[img#48] N=1000 Q=1.50 p=0.5
 |
|
|
[img#49] N=1000 Q=3.00 p=0.0001
 |
[img#50] N=1000 Q=3.00 p=0.001
 |
[img#51] N=1000 Q=3.00 p=0.005
 |
[img#52] N=1000 Q=3.00 p=0.01
 |
[img#53] N=1000 Q=3.00 p=0.02
 |
[img#54] N=1000 Q=3.00 p=0.5
 |
|
|
[img#55] N=10000 Q=1.05 p=0.0001
 |
[img#56] N=10000 Q=1.05 p=0.001
 |
[img#57] N=10000 Q=1.05 p=0.005
 |
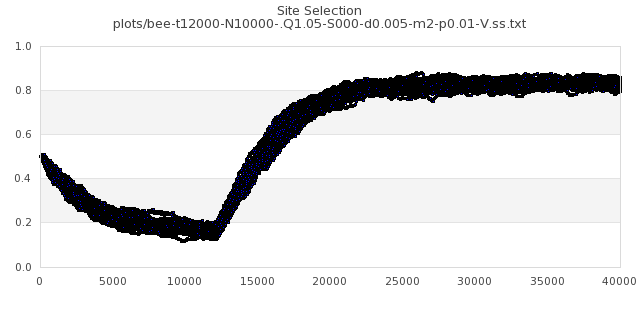
[img#58] N=10000 Q=1.05 p=0.01
 |
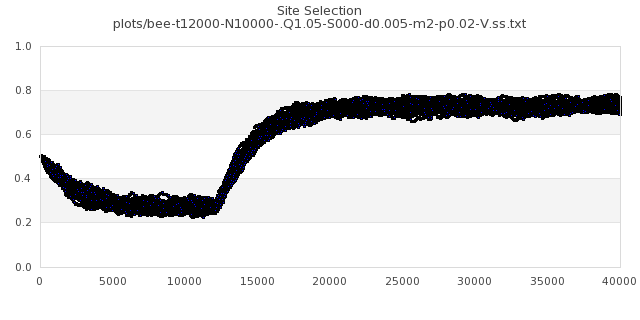
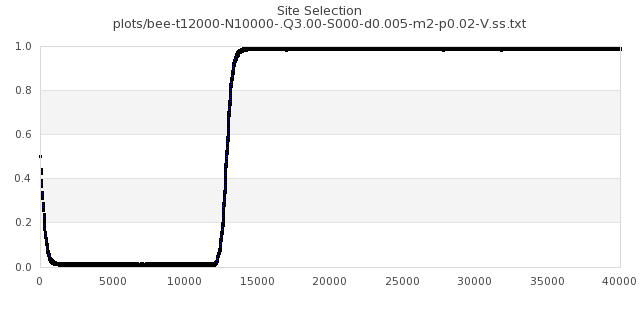
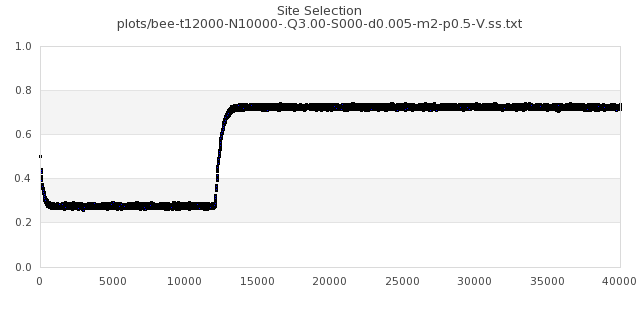
[img#59] N=10000 Q=1.05 p=0.02
 |
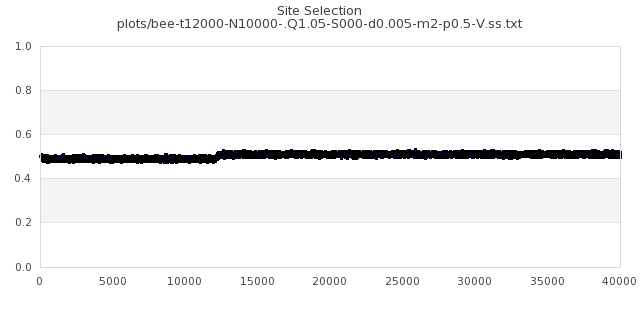
[img#60] N=10000 Q=1.05 p=0.5
 |
|
|
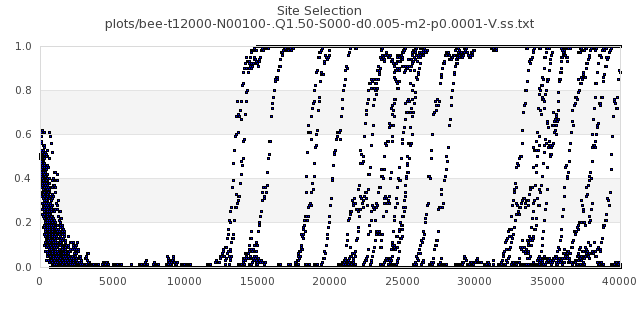
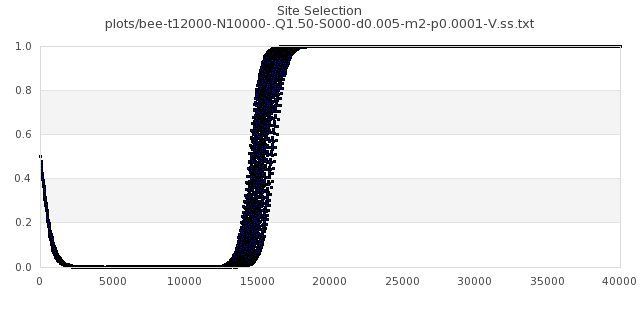
[img#61] N=10000 Q=1.50 p=0.0001
 |
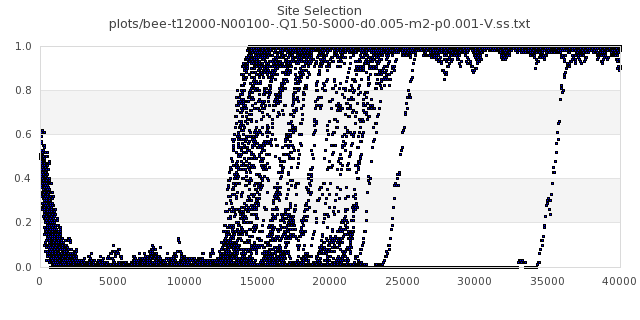
[img#62] N=10000 Q=1.50 p=0.001
 |
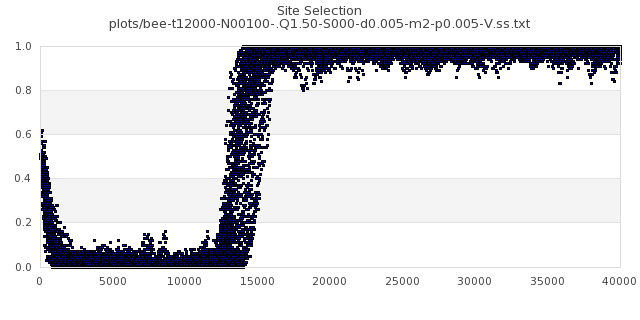
[img#63] N=10000 Q=1.50 p=0.005
 |
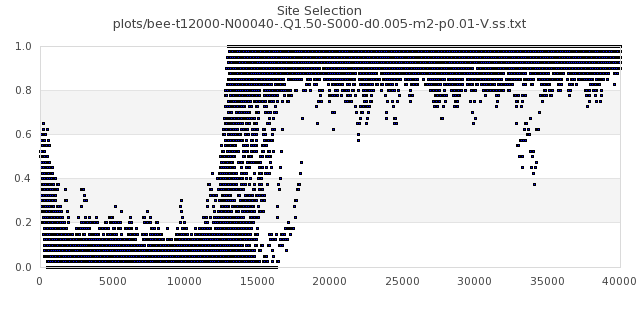
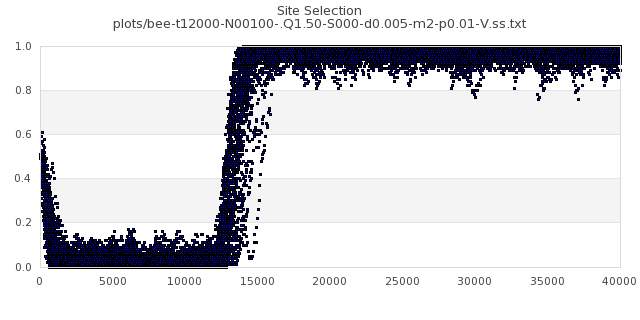
[img#64] N=10000 Q=1.50 p=0.01
 |
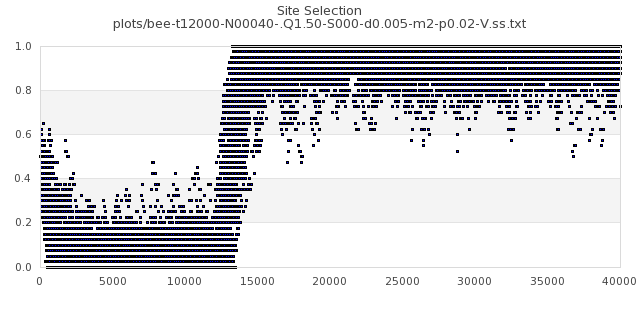
[img#65] N=10000 Q=1.50 p=0.02
 |
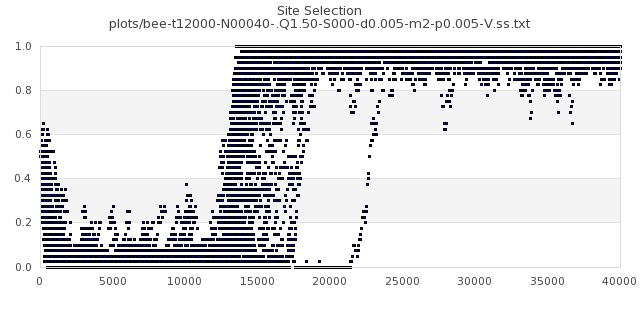
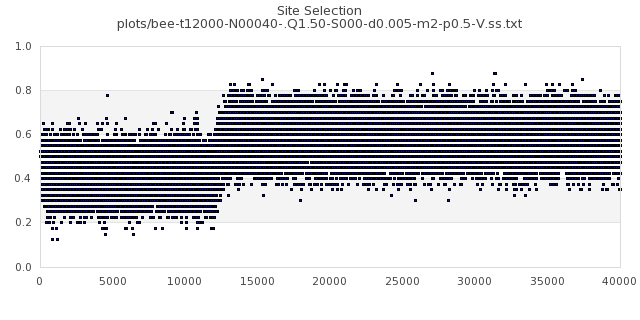
[img#66] N=10000 Q=1.50 p=0.5
 |
|
|
[img#67] N=10000 Q=3.00 p=0.0001
 |
[img#68] N=10000 Q=3.00 p=0.001
 |
[img#69] N=10000 Q=3.00 p=0.005
 |
[img#70] N=10000 Q=3.00 p=0.01
 |
[img#71] N=10000 Q=3.00 p=0.02
 |
[img#72] N=10000 Q=3.00 p=0.5
 |
|
|